Key takeaways
- Logging workers had a fatal injury rate of 110.4 per 100,000 full-time equivalent workers in 2024, about 33 times the rate for all workers.
- Roofers had 104 fatal work injuries in 2024 and a rate of 48.7, the highest of any construction trade BLS charted.
- Driver/sales workers and truck drivers had 950 fatal work injuries in 2024, more than any other occupation shown.
- U.S. fatal work injuries fell to 5,070 in 2024 from 5,283 in 2023, and the overall rate dropped to 3.3 from 3.5.
- Transportation incidents caused 38.2% of all work deaths in 2024, and falls, slips and trips caused 844.
The most dangerous job in America by fatal injury rate is logging. In 2024, logging workers died on the job at a rate of 110.4 per 100,000 full-time equivalent workers, according to the Bureau of Labor Statistics. Fishing and hunting workers (88.8) and roofers (48.7) came next. By total deaths, driver/sales workers and truck drivers led every occupation shown, with 950.
This page pulls the latest official numbers from the BLS Census of Fatal Occupational Injuries (CFOI) for 2024, released February 19, 2026. It then explains what they mean if you work in one of these jobs and want to protect your family.
Headline findings
- Logging workers had the highest fatal injury rate of any occupation BLS charted for 2024: 110.4 per 100,000 full-time equivalent (FTE) workers, with 51 deaths. That is about 33 times the all-worker rate of 3.3.
- Roofers had a rate of 48.7 and 104 deaths in 2024, the highest rate of any construction trade in the BLS chart.
- Driver/sales workers and truck drivers had 950 fatal work injuries in 2024, the most of any occupation shown, at a rate of 25.7.
- Total work deaths fell. There were 5,070 fatal work injuries in 2024, down 4.0% from 5,283 in 2023. The overall rate dropped to 3.3 from 3.5.
- Transportation incidents were the most common fatal event, at 38.2% of all work deaths in 2024. Falls, slips and trips caused 844 deaths.
Which jobs have the highest fatal injury rates?
These are the 20 occupations with the highest 2024 fatal injury rates among those BLS published in its selected-occupations chart. The last column shows how each rate compares with the rate for all workers.
Rank | Occupation (as named by BLS) | Fatal injury rate per 100,000 FTE workers, 2024 | Fatal work injuries, 2024 | Times the all-worker rate (3.3) |
|---|---|---|---|---|
1 | Logging workers | 110.4 | 51 | 33.5 |
2 | Fishing and hunting workers | 88.8 | 24 | 26.9 |
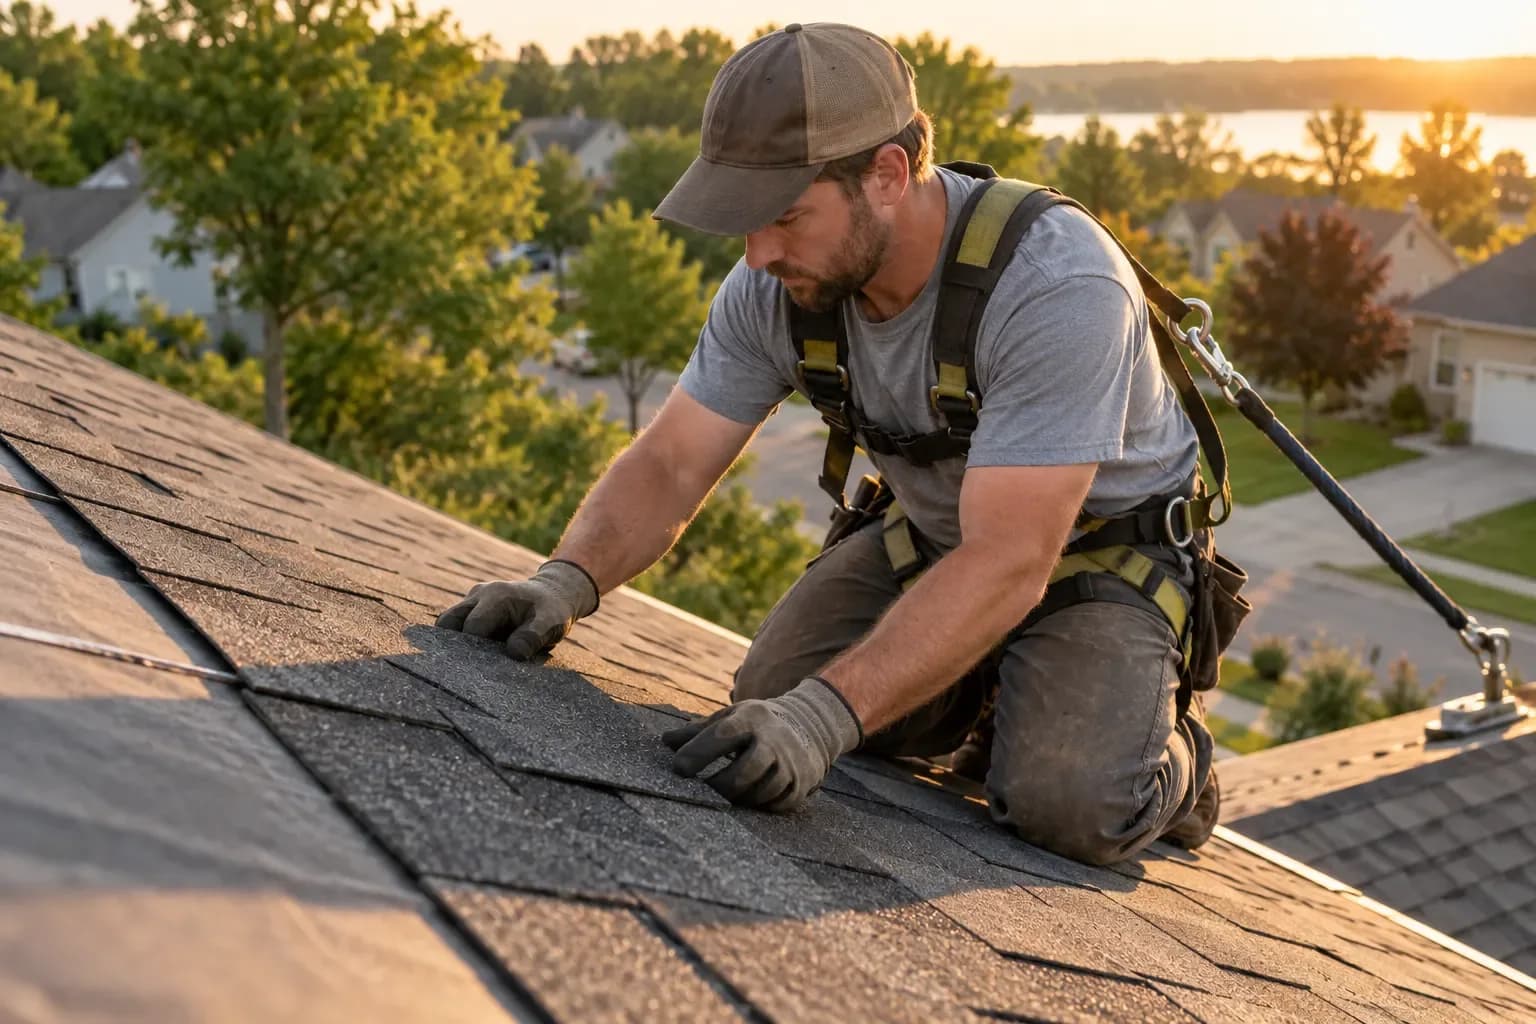
3 | Roofers | 48.7 | 104 | 14.8 |
4 | Structural iron and steel workers | 37.8 | 14 | 11.5 |
5 | Refuse and recyclable material collectors | 37.4 | 36 | 11.3 |
6 | Aircraft pilots and flight engineers | 36.7 | 73 | 11.1 |
7 | Helpers, construction trades | 35.8 | 18 | 10.8 |
8 | Underground mining machine operators | 35.6 | 12 | 10.8 |
9 | Driver/sales workers and truck drivers | 25.7 | 950 | 7.8 |
10 | Grounds maintenance workers | 20.9 | 239 | 6.3 |
11 | Farmers, ranchers, and other agricultural managers | 19.4 | 175 | 5.9 |
12 | Miscellaneous agricultural workers | 19.0 | 147 | 5.8 |
13 | Construction laborers | 15.8 | 334 | 4.8 |
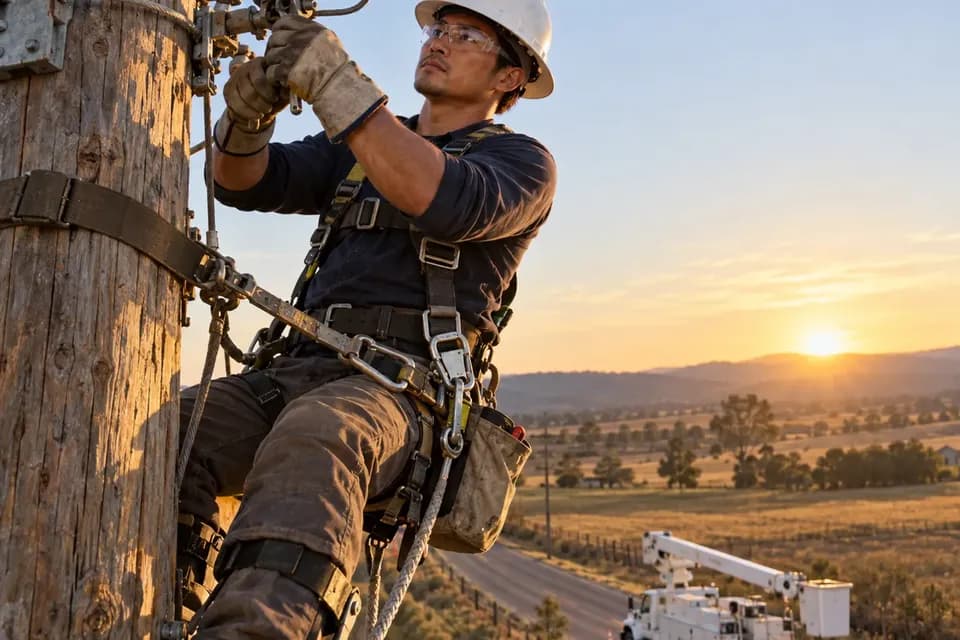
14 | Electrical power-line installers and repairers | 13.8 | 21 | 4.2 |
15 | First-line supervisors of mechanics, installers, and repairers | 13.1 | 38 | 4.0 |
16 | First-line supervisors of construction trades and extraction workers | 12.8 | 105 | 3.9 |
17 | First-line supervisors of landscaping, lawn service, and groundskeeping workers | 12.3 | 33 | 3.7 |
18 | Construction equipment operators | 11.7 | 49 | 3.5 |
19 | Telecommunications line installers and repairers | 11.5 | 15 | 3.5 |
20 | Maintenance and repair workers, general | 10.8 | 76 | 3.3 |
Rates and counts tell different stories. Structural iron and steel workers had only 14 deaths, but because relatively few people do that work, their rate was 37.8. Truck drivers had a lower rate but far more deaths, because so many people drive for a living. For a deeper look at driving jobs, see trucking deaths and injuries by the numbers.
How dangerous are the skilled trades?
Most skilled trades had fatal injury rates above the all-worker rate of 3.3 in 2024, though well below roofing and ironwork. Here are the other trade, repair and material-moving occupations in the same BLS chart:
Occupation (as named by BLS) | Fatal injury rate per 100,000 FTE workers, 2024 | Fatal work injuries, 2024 |
|---|---|---|
Bus and truck mechanics and diesel engine specialists | 8.6 | 29 |
Carpenters | 7.5 | 89 |
Industrial machinery installation, repair, and maintenance workers | 7.0 | 33 |
Pipelayers, plumbers, pipefitters, and steamfitters | 6.9 | 47 |
Welding, soldering, and brazing workers | 6.9 | 42 |
Heating, air conditioning, and refrigeration mechanics and installers | 6.7 | 33 |
Painters and paperhangers | 6.6 | 32 |
Automotive service technicians and mechanics | 6.3 | 57 |
Laborers and freight, stock, and material movers, hand | 5.4 | 110 |
Electricians | 5.3 | 53 |
Industrial truck and tractor operators | 5.0 | 30 |
Falls are a big part of the construction picture. BLS reports that construction and extraction workers had 1,032 fatal injuries in 2024, and fatal falls, slips and trips among these workers fell 7.5% to 370. Across all workers, 10.8% of fatal falls, slips and trips were from a height of more than 30 feet.
Which occupational groups have the most deaths?
At the broadest level, transportation and material moving occupations had the most deaths in 2024, while farming, fishing and forestry had the highest rate.
Major occupational group | Fatal work injuries, 2024 | Rate per 100,000 FTE workers, 2024 |
|---|---|---|
Transportation and material moving | 1,391 | 12.5 |
Construction and extraction | 1,032 | 12.6 |
Service | 824 | 3.6 |
Installation, maintenance, and repair | 437 | 8.9 |
Management, business, and financial operations | 342 | 1.1 |
Farming, fishing, and forestry | 248 | 25.4 |
Production | 238 | 3.1 |
Professional and related | 220 | 0.6 |
Sales and related | 189 | 1.5 |
Office and administrative support | 91 | 0.6 |
Source: BLS, fatal work injuries by major occupational group, 2024.
According to CFOI Table 3, construction trades workers had 788 fatal injuries in 2024, and heavy and tractor-trailer truck drivers had 798.
Methodology
- Data source. All fatality figures come from the U.S. Bureau of Labor Statistics Census of Fatal Occupational Injuries for calendar year 2024, released February 19, 2026. The CFOI counts all fatal work injuries in the United States during the year, using state, federal and independent source documents. For 2024, BLS reviewed more than 25,500 unique source documents. Data for all years in Table 3 are revised and final.
- Rates. Fatal injury rates are published by BLS as deaths per 100,000 full-time equivalent workers. BLS calculates them using employment data from the Current Population Survey and Local Area Unemployment Statistics, so they are subject to sampling error. We did not calculate any rates ourselves.
- Occupations. Occupation names and figures are taken exactly as shown in the BLS chart of rate and number of fatal work injuries in selected occupations, 2024. BLS left the rate and count blank for police officers in that chart, so that row is not included. This is not a list of every occupation in the economy, only those BLS published in that chart.
- Ranking and comparison. We ranked occupations by sorting the published 2024 rates from highest to lowest. The "times the all-worker rate" column was computed by dividing each published occupation rate by the published all-worker rate of 3.3 and rounding to one decimal place.
- What's excluded. CFOI counts exclude illness-related deaths unless an injury event started them, so deaths from long-term occupational illness are not included.
How to cite this data
Please link to this page when you use these figures: U.S. Bureau of Labor Statistics, Census of Fatal Occupational Injuries 2024, as compiled in "Most Dangerous Jobs in America: 2024 BLS Fatality Data."
What does this mean for your life insurance?
A dangerous job doesn't mean you can't get life insurance, but it does shape how you should approach it.
Your job will be part of underwriting. Insurers ask what you do, and some occupations can mean a higher premium or a specific exclusion. Our guide to life insurance for high-risk jobs explains how that works and how insurers differ.
Coverage through work may not be there. In March 2026, 49% of private-industry workers in construction, extraction, farming, fishing and forestry occupations had access to employer life insurance, according to the BLS National Compensation Survey. Group coverage also typically ends when you leave the job.
Know what actually pays. Regular life insurance generally pays for death from illness or accident, on or off the job. AD&D pays only for covered accidents. We explain the difference in does life insurance cover work accidents. Workers' comp is a separate benefit with its own limits; see workers' comp death benefits vs. life insurance.
Size coverage to your family, not your risk. The life insurance calculator can help you estimate what your family would need. More guides for trade workers are on the blue-collar workers hub.
Frequently asked questions
What is the most dangerous job in America?
By fatal injury rate, logging workers ranked highest among the occupations the Bureau of Labor Statistics charted for 2024, at 110.4 deaths per 100,000 full-time equivalent workers. Fishing and hunting workers were second at 88.8, and roofers were third at 48.7.
Check trade optionsWhich job has the most workplace deaths?
Driver/sales workers and truck drivers had 950 fatal work injuries in 2024, the most of any occupation in the BLS chart. Their rate was 25.7 per 100,000 full-time equivalent workers. Rate and count answer different questions: a large occupation can have many deaths with a lower rate.
Check trade optionsIs construction more dangerous than trucking?
At the major-group level they were nearly tied in 2024. Construction and extraction occupations had a rate of 12.6 per 100,000 full-time equivalent workers, and transportation and material moving occupations had 12.5. Within those groups, individual jobs like roofers and truck drivers vary widely.
Check trade optionsHow dangerous is being an electrician compared with other trades?
Electricians had a fatal injury rate of 5.3 per 100,000 full-time equivalent workers in 2024, above the all-worker rate of 3.3 but below many other trades. Electrical power-line installers and repairers had a much higher rate of 13.8.
Check trade optionsCan I get life insurance if I work one of these jobs?
Often, yes. Insurers ask about your job, and a hazardous occupation can mean a higher premium, an occupation exclusion or, in some cases, a decline. Each insurer sets its own rules, so comparing more than one insurer can matter. Describe your duties accurately on the application.
Check trade optionsSources
- U.S. Bureau of Labor Statistics — Census of Fatal Occupational Injuries Summary, 2024 (released February 19, 2026)
- U.S. Bureau of Labor Statistics — Rate and number of fatal work injuries in selected occupations, 2024
- U.S. Bureau of Labor Statistics — Number and rate of fatal work injuries by major occupational group, 2024
- U.S. Bureau of Labor Statistics — CFOI Table 3: Fatal occupational injuries for selected occupations, 2020-24
- U.S. Bureau of Labor Statistics — CFOI technical notes, 2024
- U.S. Bureau of Labor Statistics — National Compensation Survey, Table 5: Life insurance benefits, March 2026
About the author
Editorial TeamResearch & editorial
Our editorial team researches and writes these guides from primary sources — including the VA, IRS, Social Security Administration, CFPB, NAIC, and NFDA — and updates them as rules and figures change. Guides are general information, not financial, legal, or tax advice.